| ‹ 2010 | ||||
| United Kingdom general election, 2015 | ||||
|---|---|---|---|---|
| All 650 seats in the House of Commons 326 seats needed for a majority | ||||
| 7 May 2015 | ||||
| Turnout | 66.1% | |||
| First party | Second party | Third party | ||
|
|

| ||
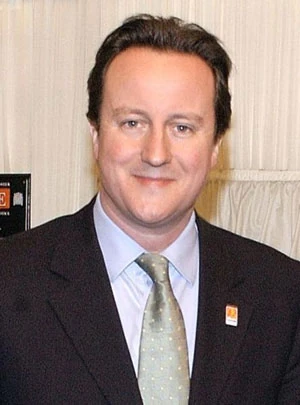
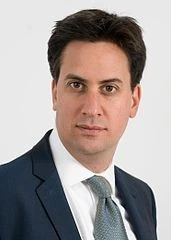
| Leader | David Cameron | Ed Miliband | Angus Robertson | |
| Party | Conservative | Labour | Scottish National Party | |
| Leader's seat | Witney | Doncaster North | Moray (Lost his seat) | |
| Last election | 306 seats, 36.1% | 258 seats, 29% | 6 seats, 1.7% | |
| Seats before | 302 | 256 | 6 | |
| Seats won | 325 | 243 | 38 | |
| Seat change | ▲ 19 | ▼ 15 | ▲ 32 | |
| Popular vote | 11,049,005 | 9,207,504 | 1,043,517 | |
| Percentage | 36% | 30.0% | 3.4 | |
| Swing | ▼ 0.1% | ▲ 1% | ▲ 1.7% | |
| Fourth party | ||||
|
||||
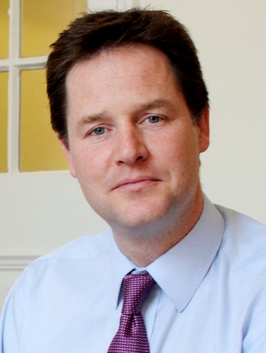
| Leader | Nick Clegg | |||
| Party | Liberal Democrats
| |||
| Leader's seat | Sheffield Hallam | |||
| Last election | 57 seats, 23.0% | |||
| Seats before | 56 | |||
| Seats won | 20 | |||
| Seat change | ▼ 36 | |||
| Popular vote | 2,915,710 | |||
| Percentage | 9.5 | |||
| Swing | ▼ 13.5%
| |||

| ||||
| Colours show the winning party in each constituency. | ||||
Prime Minister before election
David Cameron Conservative
Elected Prime Minister
David Cameron Conservative | ||||
Results[]
Polling stations opened at 7:00 and closed at 22:00 and the count was completed in the afternoon of Friday 8 May.
| Results of the United Kingdom general election, May 7 2015 | |||||||||
|---|---|---|---|---|---|---|---|---|---|
| Party | Leader | Leader's seat | Seats | Votes | |||||
| No. | % | ± | No. | % | ± | ||||
| Conservative | David Cameron | Witney | 325 | 50% | ▲ 19 | 11,049,005 | 36% | ▼ 0.1% | |
| Labour Party | Ed Miliband | Doncaster North | 243 | 37.38% | ▼ 15 | 9,207,504 | 30.0% | ▲ 1% | |
| Liberal Democrats | Nick Clegg | Sheffield Hallam | 20 | 3% | ▼ 37 | 2,915,710 | 9.5% | ▲ 13.5% | |
| UKIP | Nigel Farage | Candidate for Thanet South (Won) | 3 | 0.46% | ▲ 3 | 4,143,377 | 13.5% | ▲ 10.4% | |
| Scottish National | Angus Robertson | Moray (Lost his Seat) | 38 | 5.85% | ▲ 32 | 1,441,364 | 3.4% | ▲ 1.7% | |
| Green | Caroline Lucas | Brighton Pavilion | 1 | 0.15% | ▬ 0 | 265,243 | 5.5% | ▲ 0.2 | |
| Plaid Cymru | Elfyn Lwyd | Dwyfor Meirionnydd | 4 | 0.62% | ▲ 1 | 165,394 | 0.6% | ▬ 0 | |
| Democratic Unionist Party | Nigel Dodds | Belfast North | 8 | 1.23% | ▬ 0 | 184,260 | 0.6% | ▬ 0 | |
| Sinn Fein | Gerry Adams | ‘‘Did not Stand’’ | 4 | 0.62% | ▼ 1 | 176,232 | 0.6% | ▬ 0 | |
| Ulster Unionist Party | Tom Elliot | Fermanagh and South Tyrone | 2 | 0.31% | ▲ 2 | 114,935 | 0.4% | ▲ 0.1 | |
| Social Democratic and Labour Party | Alasdair McDonnell | Belfast South | 3 | 0.46% | ▬ 0 | 99,809 | 0.3% | ▼ 0.1 | |
| Others | - | - | 1 | 0.15% | ▼ 4 | 346,436 | 1.13% | ▬ 0 | |
| Speaker (John Bercow) | Buckingham | 1 | 0.15% | ▬ 0 | 34,617 | 0.1% | ▬ 0 | ||
| Total (Turnout: 66.1%) | 650 | 100% | ▬ 0 | 30,691,680 | 100% | - | |||
| ↓ | ||||||||||||
| 325 | 243 | 38 | 20 | 8 | 4 | 4 | 3 | 3 | 2 | 1 | 1 | 1 |
| Conservatives | Labour | SNP | Lib Dems | DUP | PC | SF | SDLP | UKIP | UUP | Green | Ind | Speaker |